
DevTools
DevTools help you test websites and other HTML-based content by allowing you to inspect elements and make changes in real time.
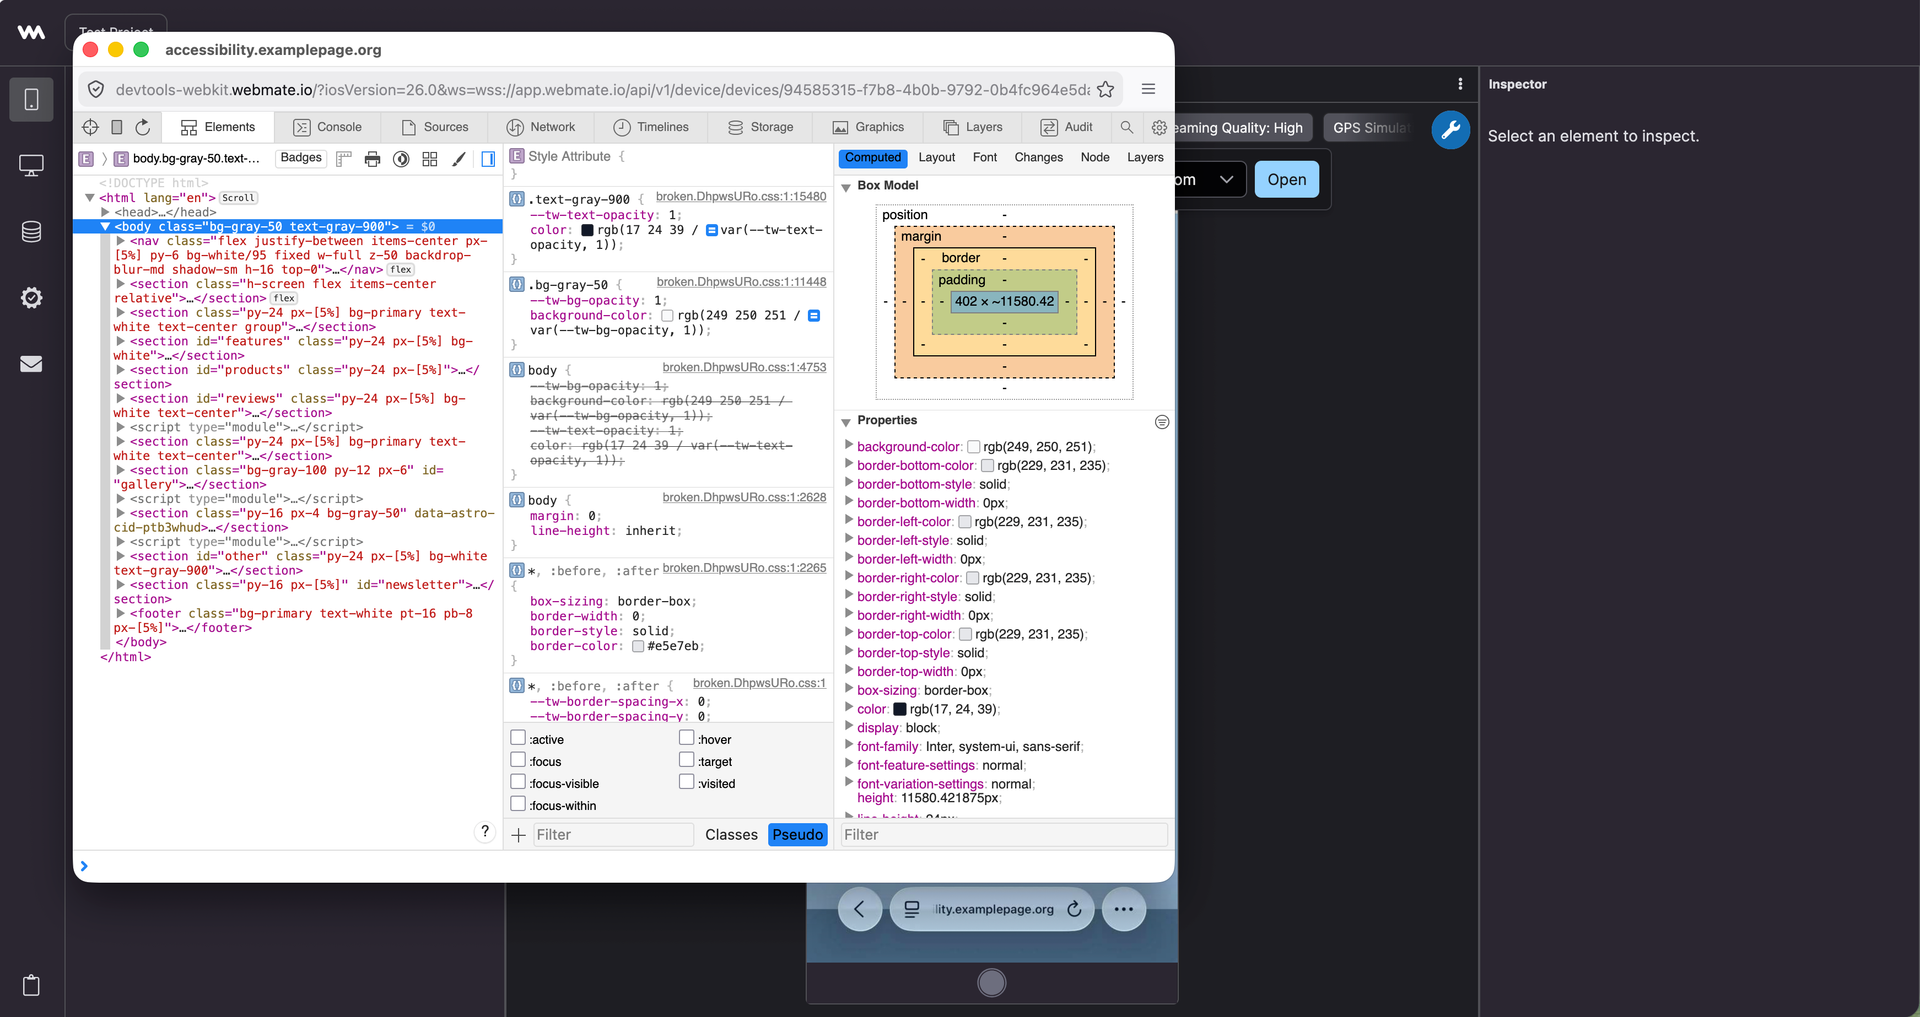
The DevTools Workbench integration opens the native browser inspector for a compatible live session. Android devices with Chromium-based browsers use Chrome DevTools, while iOS devices with Safari or inspectable WebViews use WebKit Inspector.
Prerequisites
Before you start:
- DevTools integration is enabled for your account. Contact webmate support if the DevTools button is not available.
- The selected device supports DevTools. Compatible devices expose the
machine.devtools.availableproperty. - A live Workbench session is running on the compatible device.
- The browser tab, page, or WebView that you want to inspect is already open on the device.
Open DevTools
- Open the Workbench for the compatible device.
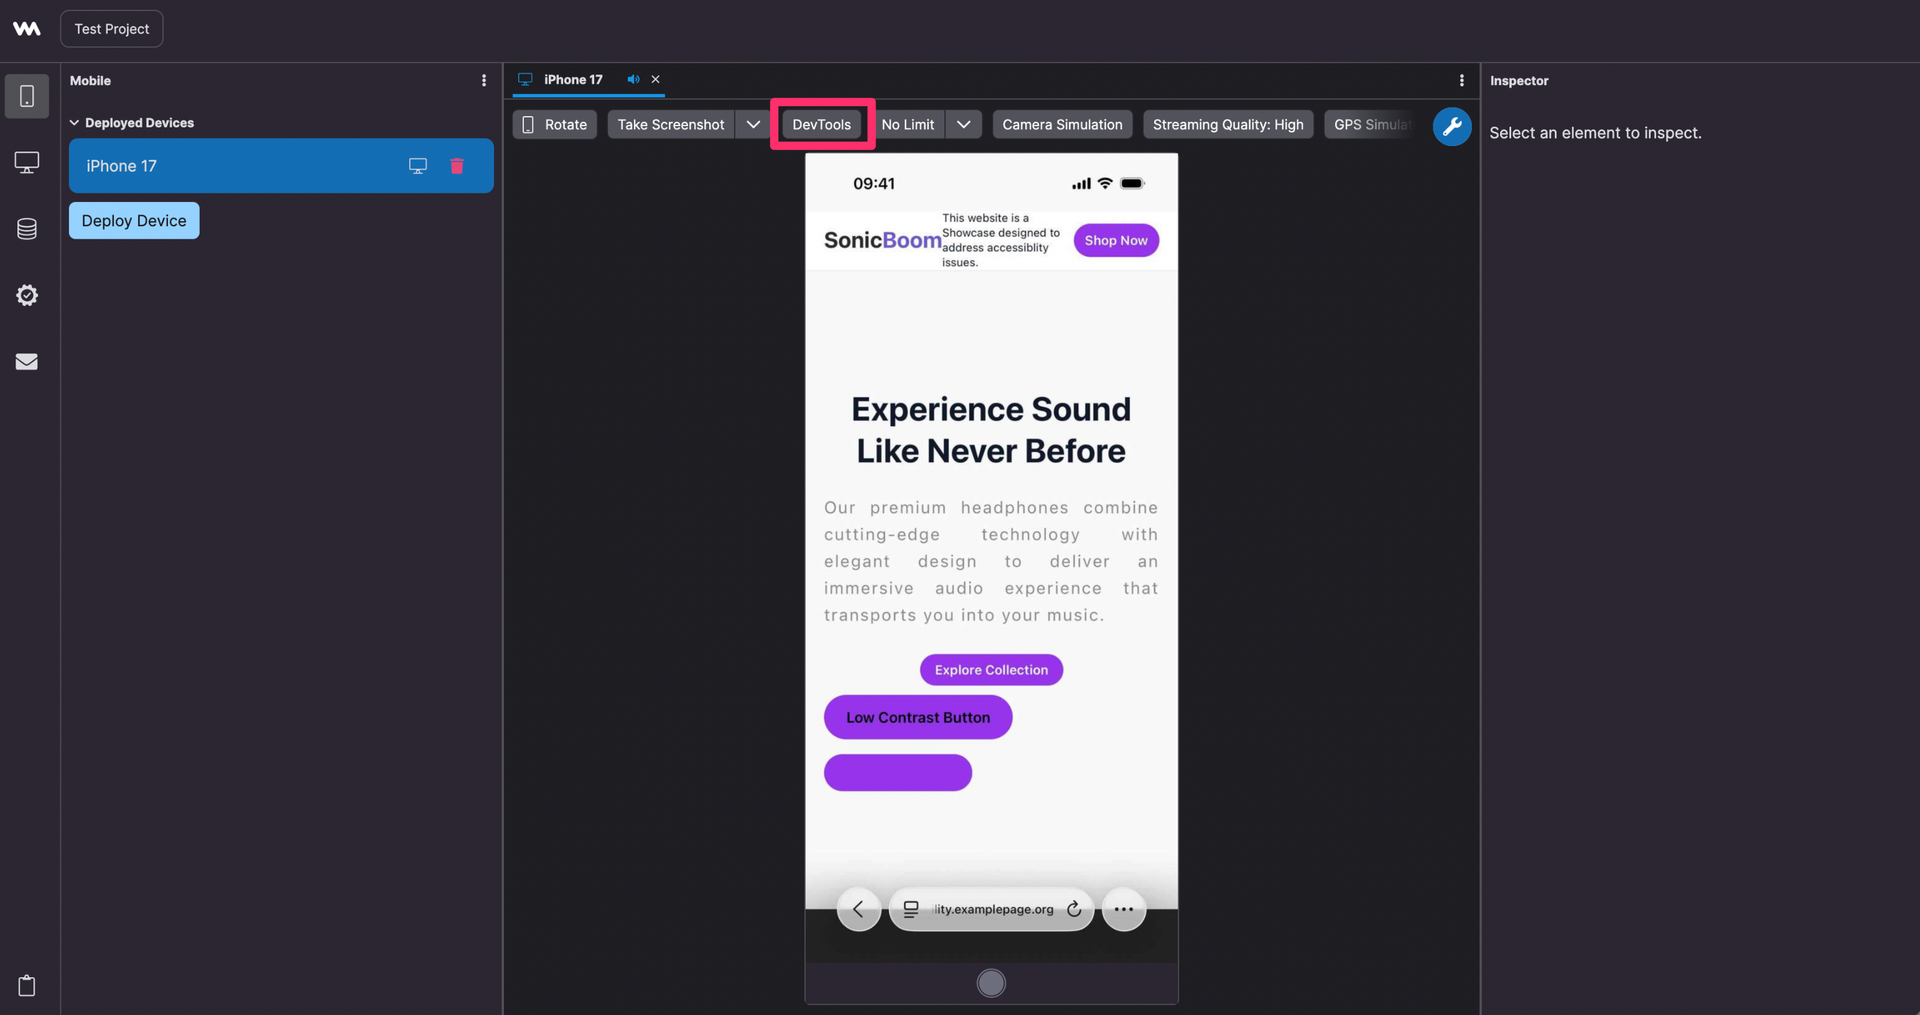
- Click DevTools in the console toolbar.
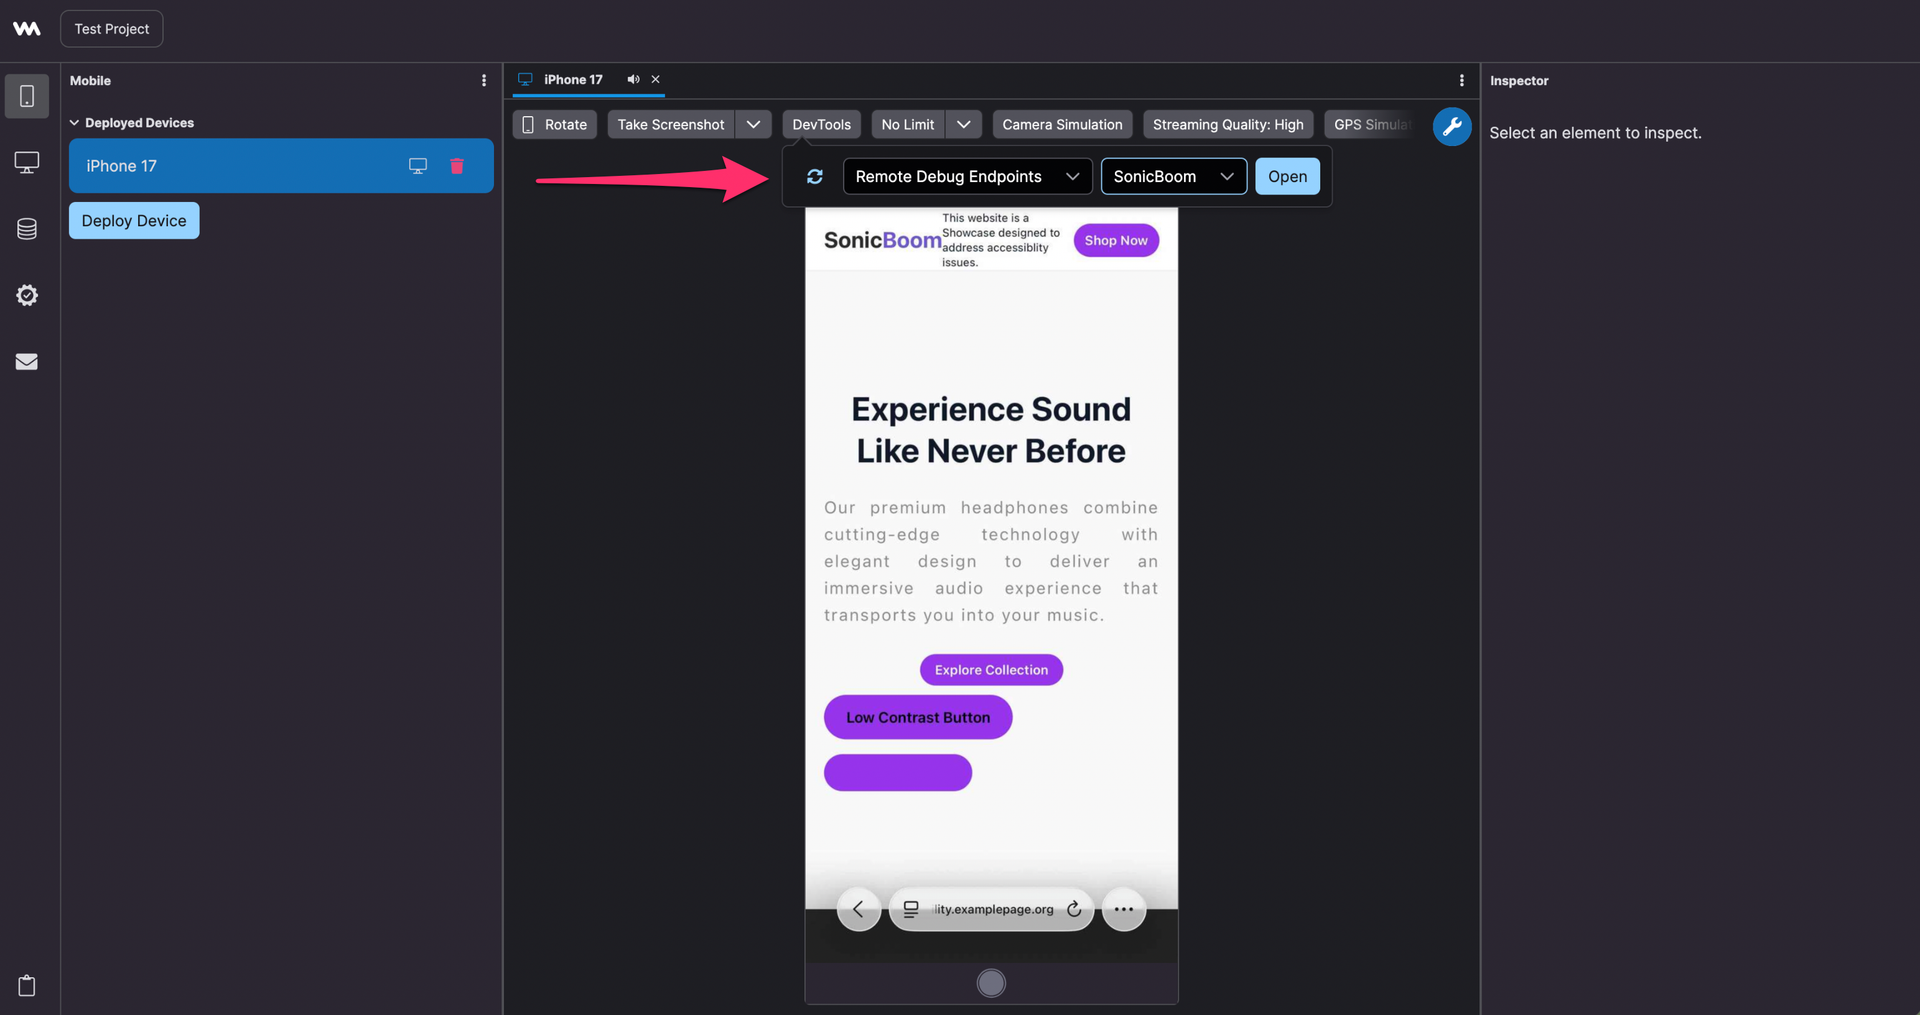
- Select a debug endpoint. Each endpoint represents a browser or WebView running on the device, such as Chrome or Safari.
- If no endpoint appears, click Refresh to scan again.
- Select a target. Targets are the individual tabs or pages exposed by the selected endpoint.
- Click Open to launch DevTools in a new window.
The connection is authenticated automatically with the current Workbench session. You do not need to pass an additional access token manually.
Supported Devices
Android devices with Chromium-based browsers use the Chrome DevTools Protocol. The inspector opens through http://devtools-chrome.webmate.io.
iOS devices with Safari or inspectable WebViews use WebKit Remote Debugging. The inspector opens through http://devtools-webkit.webmate.io.
If the target list is empty, make sure the page or WebView is open on the device, then refresh the endpoint and target lists.