Analyze test runs
In this article we will go over the possibilities to analyze “normal” test runs. For cross-browser test runs please refer to here and for mail test runs to here .
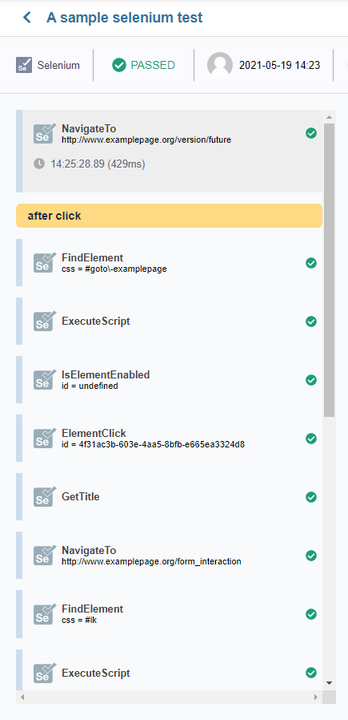
When you open a test run from the TestLab by clicking on its entry in the list of test runs you will see some general information at the top. At the left you see what kind of test it was, e.g. a Selenium test, then if the test was passed, failed, etc., the time and date, browser and tags.

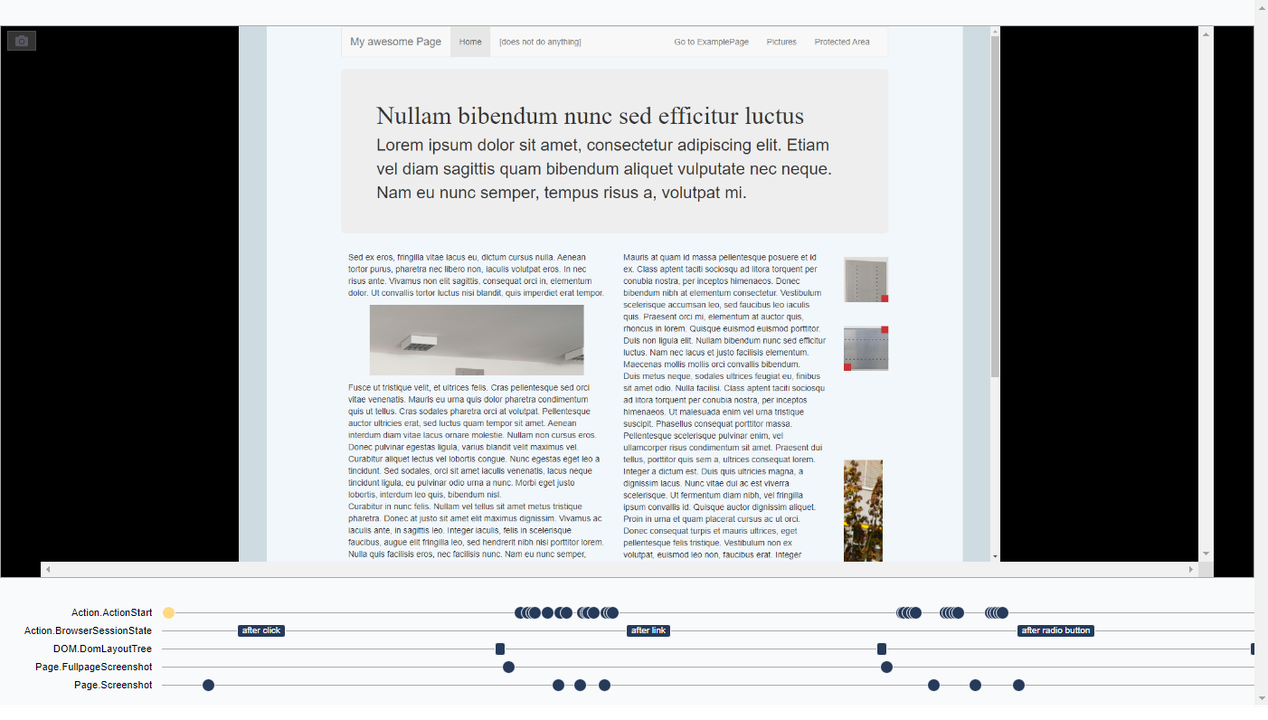
The majority of the screen is occupied by the screenshot area and the timelines below. In the timelines you see a dot at each point where an action was taken in the upper timeline and each point where a screenshot was taken in the lower timeline. By clicking on any of those dots the according screenshot is displayed in the area above.
At the left you see a list in chronological order of all interactions with the website or mobile app. Everything from visiting a new URL, clicking an element, finding an element by XPath etc., is listed there and you can click on any state to see the according screenshot in the screenshot area as before with the timeline dots.